Cities in the U.S. and Canada stand to lose $92.96 billion per year to risks like market crash, cyber attack and flood, an index from Lloyd’s released today shows.
Lloyd’s newly issued City Risk Index, which produces estimates of how much savings are needed to deal with anticipated risks, shows that North American cities lead global rankings for technology and space threats, and are critically exposed to financial loss through extreme climate.
The report also shows North American cities could save $2.9 billion each year by improving their levels of resilience.
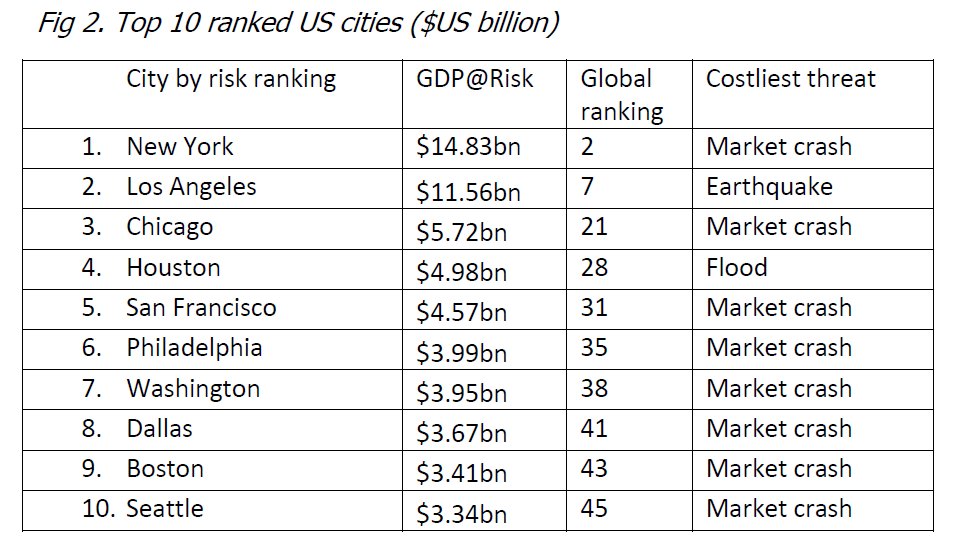
New York City is ranked second in the world in GDP@Risk, and should expect to lose $14.83 billion to risk each year, topping the world in risks including market crash, flood, cyber attack and human pandemic.
GDP@Risk is an expected loss figure that is a projection based on the likelihood of the loss of economic output from the threat.
The index measures the GDP@Risk of 279 cities across the world from 22 threats in five categories: finance; economics and trade; geopolitics and security; health and humanity; natural catastrophe and climate; and technology and space. Those listed in the index are some of the world’s leading cities, collectively generating 41 percent of global GDP.
The latest index shows how much it would cost a city annually from rare risk events, like an earthquake, that might only take place once every few years, or from more frequently occurring events like cyber attacks.
Cyber is becoming more frequent and poses ever greater threats, but not too many entities are insured for these events, according to Trevor Maynard, head of innovation at Lloyd’s.
“We’ve done quite a bit of research on cyber recently, and published a few reports on that subject, and they show very significant under insurance in cyber,” Maynard said. “You know, maybe only 10 or 20 percent of businesses have cyber coverages, so we definitely would say that people are not as prepared for cyber as they would be for some other risks.”
Allianz Global Corporate & Specialty in a report in March also concluded that small- and medium-sized enterprises underestimate their cyber exposures, but that some of them are waking up to the realities of cyber risks.
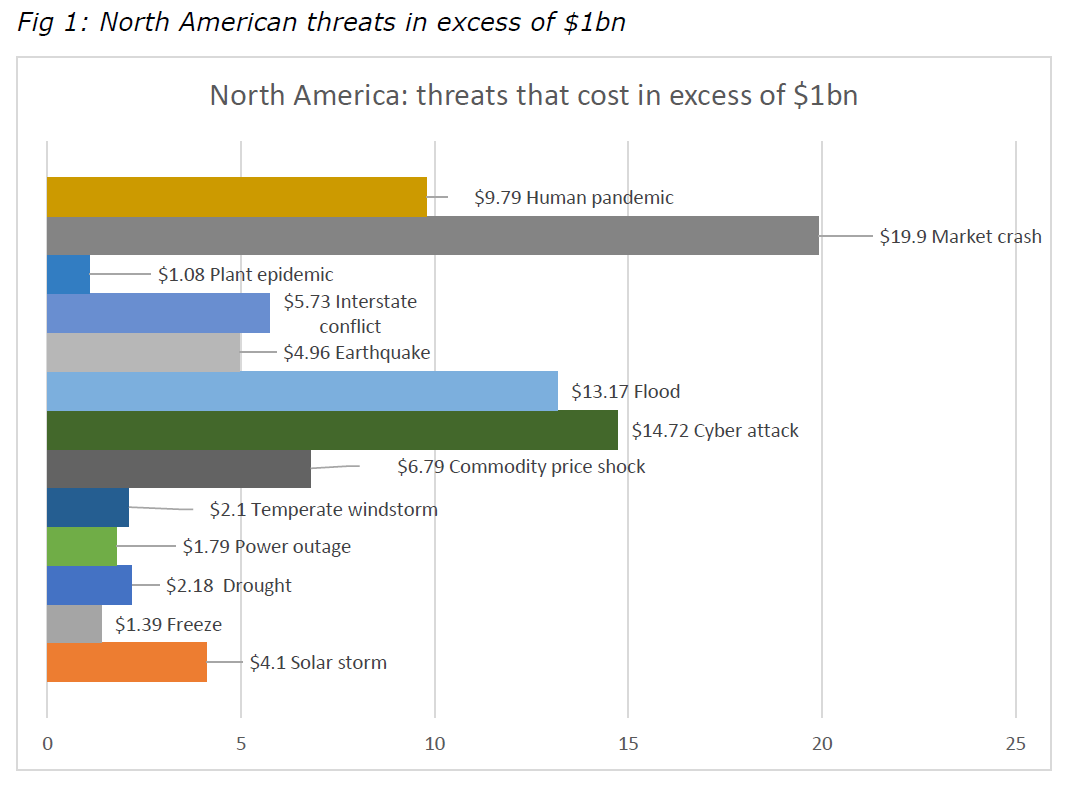
Market crash is the costliest risk listed in the index for more than two-thirds of North American cities with a combined cost of $19.9 billion. This is because the economies of U.S. cities are heavily reliant on private capital, which means should any disruption take place, they stand to lose.
In North America, the leading risks after market crash ($19.90 billion) are cyber attack ($14.73 billion) and flood ($13.17 billion).
The index shows that $546.50 billion is globally at risk each year from all 22 threats. The largest global threats are: market crash ($103.33 billion); interstate conflict ($80.00 billion); and tropical windstorm ($62.58 billion).
Manmade threats worldwide account for 59 percent of the total GDP@Risk and climate-related risks account for $122.98 billion of lost GDP.
Tokyo leads stands to lose the most GDP through risk. Tokyo’s GDP@Risk is measured at $24.31 billion. New York ($14.83 billion), and Manila ($13.27 billion) follows.
Other U.S. cities near the top of this risk index include Los Angeles ($11.56 billion), Chicago ($5.72 billion), Houston ($4.98 billion) and San Francisco ($4.57 billion).
Thirty-four cities in North America – 28 in the U.S. and six in Canada – account for 17 percent of the global GDP@Risk total. The GDP@Risk in those cities amounts to a collective $92.96 billion each year from all 22 threats.
Forty-four percent of North America’s exposure comes from natural causes, and 56 percent is from manmade risks. Climate threats account for just over 20 percent, according to the index.
Climate change is listed as a chief threat in the index for cities including New York, with the biggest perils including flood, heatwave and freeze.
“Climate change will have an increasing impact on the U.S. economy,” the index report says, noting that the global sea-level rise of 20cm since the 1950s contributed to an increase in New York’s insured losses of $20 billion to $25 billion from Superstorm Sandy by 30 percent. A report from the World Meteorological Organization released in 2016 showed Earth experienced its hottest half-decade on record between 2011 and 2015, and it indicated that the severity of Sandy may have been a result of that.
Chicago’s risk profile resembles New York’s. The three costliest threats to Chicago’s GDP are market crash ($1.22 billion), flood ($0.97 billion) and cyberattack ($0.92 billion).
In Los Angeles water from storms as well as lack of water pose a combined threat of $2.43 billion to GDP, while earthquake is a threat to the city to the tune of $2.70 billion annually, according to the index.
Maynard noted that the index gives expected long-run averages, and that anticipated GDP hits on each city should be viewed in context.
“If you look at Los Angeles for example, the GDP at risk from earthquake is $2.7 billion, which actually is not a very large number,” he said. “It probably sounds large, but in the context of the L.A. economy, it isn’t. But actually, an extreme earthquake, if it happened in L.A., could cost around $380 billion, and an average-sized earthquake would be around $117 billion.”
Users of the risk index can run scenario losses and see the forecast cost of an event happened in a given year.
“And those numbers are much larger than the long-term average costs, which are a savings rate,” Maynard said. “And they really make the case for risk transfer because, you know, the point is that if you put aside a little bit each year, or you buy insurance, then you can be prepared for those really large losses when they finally arrive, and they’re bound to arrive at some point.”
Fonte: